Steps
Access the graph for which you want to enable or disable the logarithmic scale.
Tip: You can also access a graph from the Catalog.
In the upper-right corner of the workspace, select
The Settings pane appears.
Select the Axis tab.
The Axis section appears.
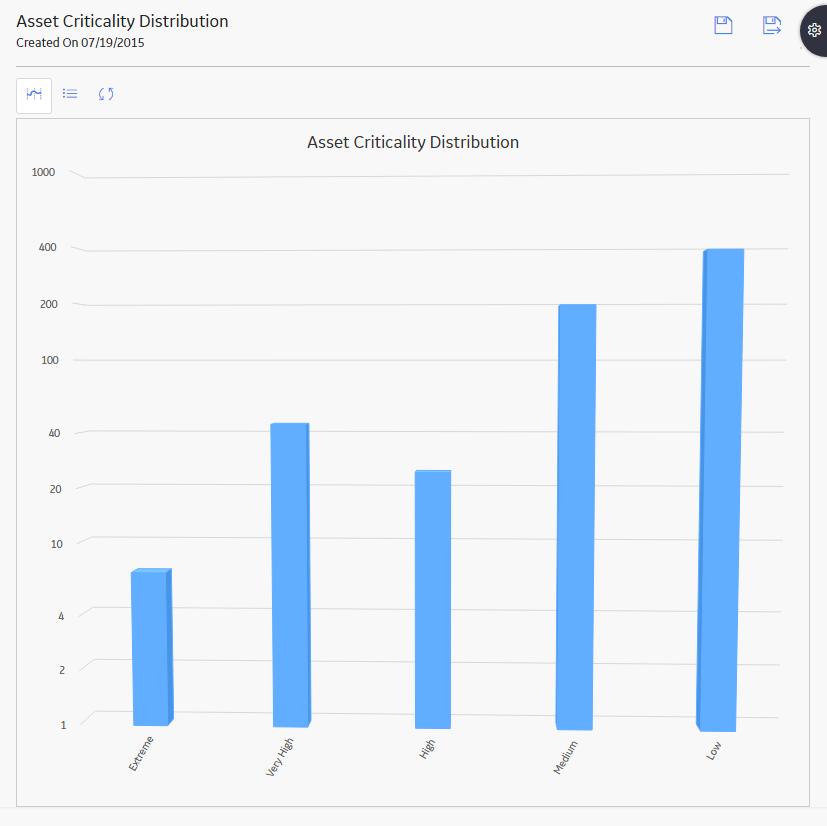
If you want to enable the logarithmic scale, select the Logarithmic check box.
The graph is refreshed to reflect the logarithmic scale.
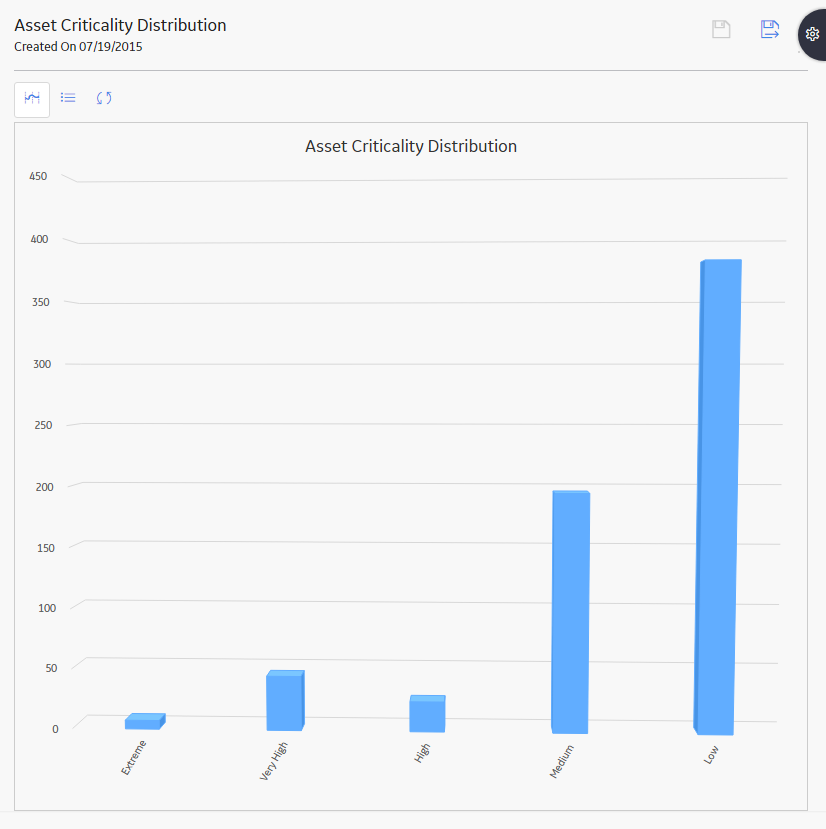
If you want to disable the logarithmic scale, clear the Logarithmic check box.
The graph is reverted to its original scaling.
The Logarithmic option lets you specify that you want to display values as logarithms. This is useful when you are working with a wide range of values so that the graph can display the values on a more manageable scale. For example, the following image shows a graph whose values on the scale are displayed using the Number format option when the Logarithmic check box is cleared.
If you were to select the Logarithmic check box, the same graph would appear as shown in the following image.
Copyright © 2018 General Electric Company. All rights reserved.