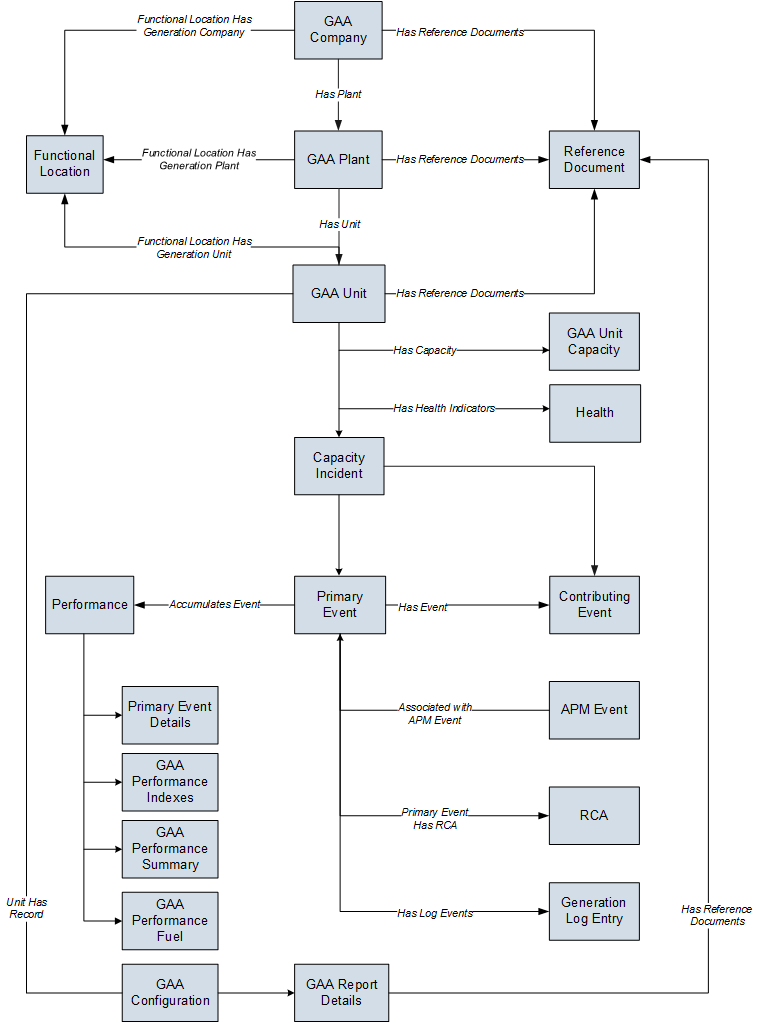
The following diagram shows how the families used in GAA are related to one another.
Note: In the diagram, boxes represent entity families and arrows represent relationship families that are configured in the baseline database. You can determine the direction of the each relationship definition from the direction of the arrowhead: the box from which the arrow originates is the predecessor, and the box to which the arrowhead points is the successor.
In addition to the families shown in the GAA data model, the following additional families are used for GAA reference:
Copyright © 2018 General Electric Company. All rights reserved.