When you access an Asset Criticality Distribution Graph, in the Overview section, the graph displays a breakdown of the numbers of pieces of equipment in the database that are ranked based on the risk.
Asset Criticality Distribution graph plots the number of pieces of equipment in the database with the corresponding risk rank values. This plot is a distribution of Asset Criticality that is related to the selected hierarchy level.
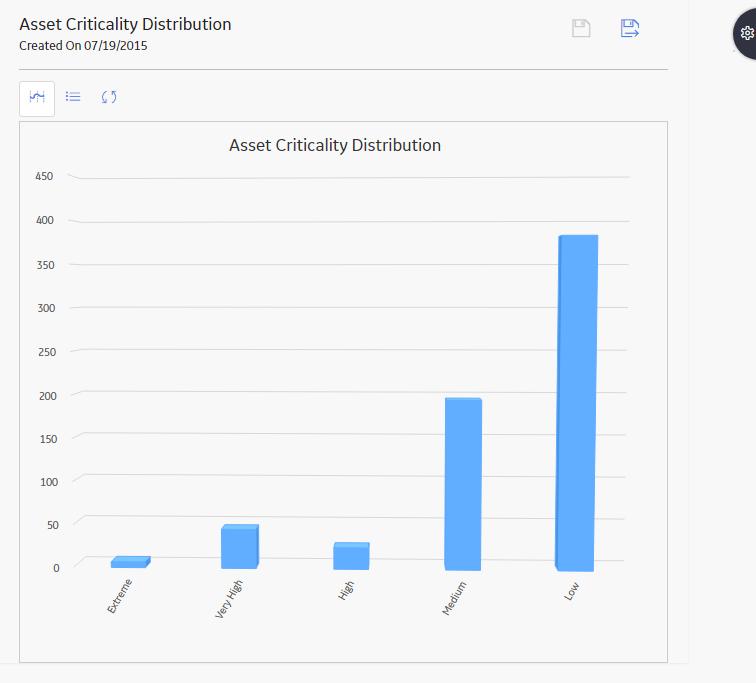
When you view the Asset Criticality Distribution graph for a system, it might look similar to the following image.
Copyright © 2018 General Electric Company. All rights reserved.