When you access an ACA Analyses by State graph, in the Overview section, the graph displays the number of Analyses and the states of the Analyses.
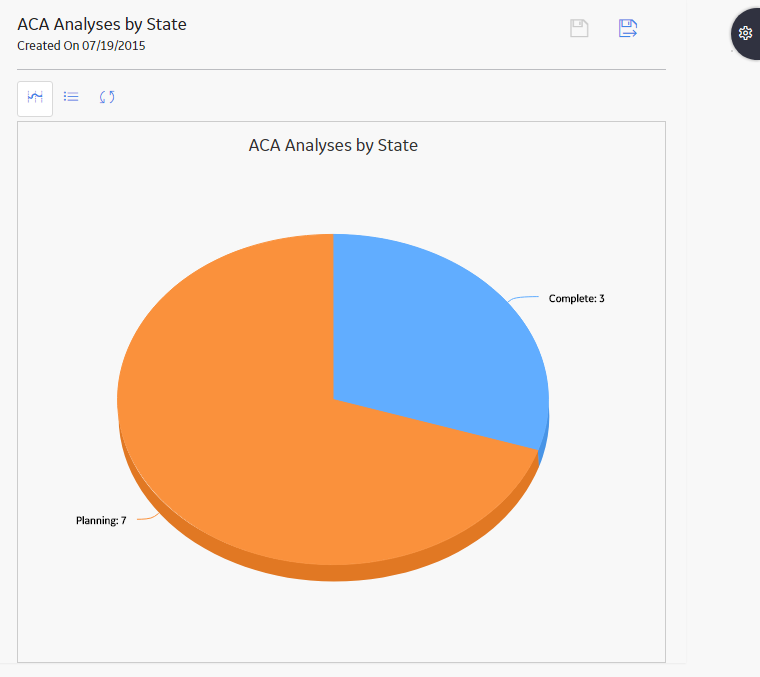
ACA Analyses by State graph plots the number of ACA Analyses in the database with the corresponding Analysis state: Planning, Active, Review, Pending Approval, and Complete. This plot is a distribution of ACA Analyses that are related to the selected hierarchy level.
When you view the ACA Analyses by State graph for a system, it might look similar to the following image.
Copyright © 2018 General Electric Company. All rights reserved.