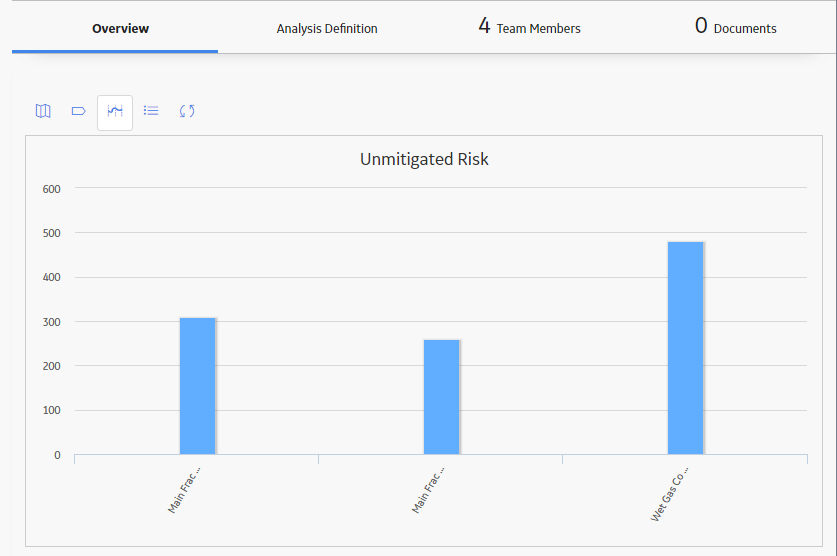
When you access an ACA, in the Overview section, the Unmitigated Risk graph displays the unmitigated risk value for each system that is associated with that ACA.
If you select one of the system nodes associated with that ACA, in the left pane, in that system's Overview section, the Unmitigated Risk graph displays the unmitigated value for each Equipment and Functional Location record that is associated with that system.
In this way, you can drill down into a series in the ACA Unmitigated Risk graph to view the unmitigated risk value for the records that appear on a subsequent row in the grid on the Asset Criticality Analysis page.
When you view the ACA Unmitigated Risk graph for a system, it might look similar to the following image.
Copyright © 2018 General Electric Company. All rights reserved.