The SCADA Sync Monitor displays information about the primary and secondary SCADA Servers. You can use it to view diagnostic information about your Enhanced Failover configuration, or for troubleshooting issues with your Enhanced Failover configuration.
The SCADA Sync Monitor displays whether the selected SCADA is in active or standby state, shows how often database synchronizations occur, whether the database synchronization networks are in good communication, debug log messages that occur during synchronization of the databases, SAC information, and the overall system health on both nodes. You can view the status and information from either SCADA by selecting either the local or partner SCADA.
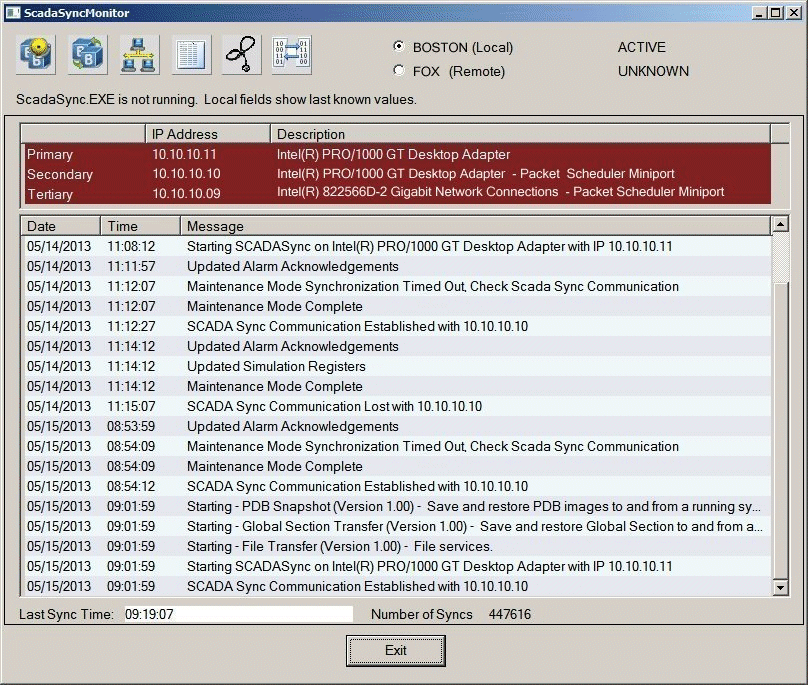
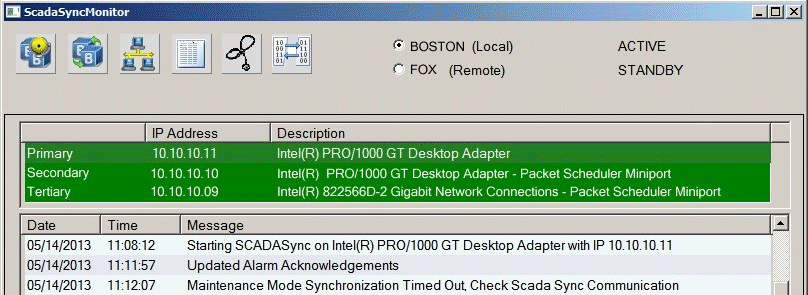
The following figures illustrate the ScadaSyncMonitor dialog box. The top section of this dialog box contains six SCADA Sync Monitor toolbar buttons. To the right of the toolbar buttons, there are two option buttons, which allow you to select either the local or partner SCADA node. The status of both nodes displays to the right of the buttons.
- When ScadaSync.exe is not running, an alert message under the toolbar indicates that "ScadaSync.exe is not running. Local fields show last known values." Below this alert message, the Primary, Secondary, Tertiary IP Address and Descriptions area displays white text in a red area.

ScadaSync.exe Not Running
- When ScadaSync.exe is running, there is no alert message under the toolbar. The Primary, Secondary, Tertiary IP Address and Description area displays in white text in a green area to indicate that the communication networks are all in good health. The partner nodes are communicating successfully with each other, and that all three networks are available.

ScadaSync.exe Running
 To open the SCADA
Sync Monitor:
- Open Windows Explorer and locate the iFIX install folder. By default, this folder is: C:\Program Files (x86)\Proficy\iFIX.
- Double-click the ScadaSyncMonitor.exe file. The SCADA Sync Monitor dialog box displays.
- Click the button in the toolbar for the information that you want to display. Also, select either the local or partner node using the radio buttons. For information on the toolbar buttons, refer to the table in the following section.
NOTE: • When starting your SCADA pair the connection state flow displayed in SCADA Sync Monitor may be different based on the protocol used. When using the TCP protocol, both SCADAs may spend a short time in the Active state until the TCP connection is established and they negotiate their respective roles. Also, be aware that it takes longer for SCADA Sync to initially get to an Active / Standby state with TCP than UDP.
Toolbar for SCADA Sync Monitor
The following table describes the functions of each of the icons in the toolbar for the SCADA Sync Monitor. You can use the drop-down list to view the active or standby node.
|
Icon |
Function |
|
|
Overview of the SCADA Node Synchronization History |
|
|
PDB Synchronization Status |
|
|
Communication Status |
|
|
Debug Log for Troubleshooting |
|
|
Overall System Health |
|
|
Global Memory Synchronization Status (Internal Troubleshooting Tool, for Customer Support and Development) |


